Biography
I am a data scientist with background in quantitative methods and interest in data-driven models of human aging. I subscribe to aspirations of open science and reproducible research.
Read my academic biography.
See my work on github at /andkov
Interests
- Graph Making
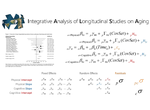
- Longitudinal Modeling
- Health Informatics
Education
-
PhD in Quantitative Methods, 2014
Vanderbilt University
-
MA in Quantitative Psychology, 2008
Middle Tennessee State University
-
BSc in Mass Communication, 2005
Middle Tennessee State University