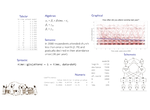
Income Assistance in Alberta
Graphing the trends of assured income for severely handicapped (AISH)
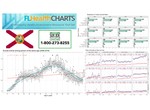
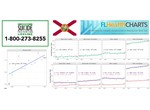
Florida Suicides (2) - Youth Trends
Graphing the trends of suicides in Florida from 2006 to 2017 among youth between 10 and 24 years of age.
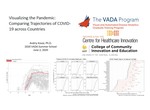
Visualizing the Pandemic
Demonstrating how to 1) build interactive visualizationsusing
plotly::ggplotly(), 2) compute relative timelines for each country and 3) …
Online Courses and Textbooks
A list of learning resources that I like having on speed dial
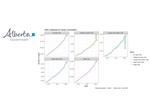
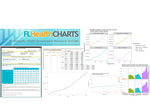
Florida Suicides (1) - General Trends
Graphing the trends of suicides in Florida from 2006 to 2017, exploring the differences in age, gender, and race among persons 10 years …
Florida Demographic Growth
This blogposts shows how to extract population estimates data reported by the Florida Department of Health and prepare them for …
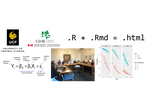
Managing Data Analysis with RStudio
Recent example of 1) interpreting models through graphs rather than parameters 2) using self-contains RMarkdown notebook vs .R + .Rmd …
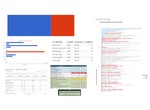
What Lies Beyond Acute Care Data
Using service utilization data of 4,067 residents of Vancouver Island with sever alcohol addiction we demonstrate the cross-continuum …
Academic Biography
I am a data scientist with background in quantitative methods and interest in data-driven models of human aging.
I received my Ph.D. in …