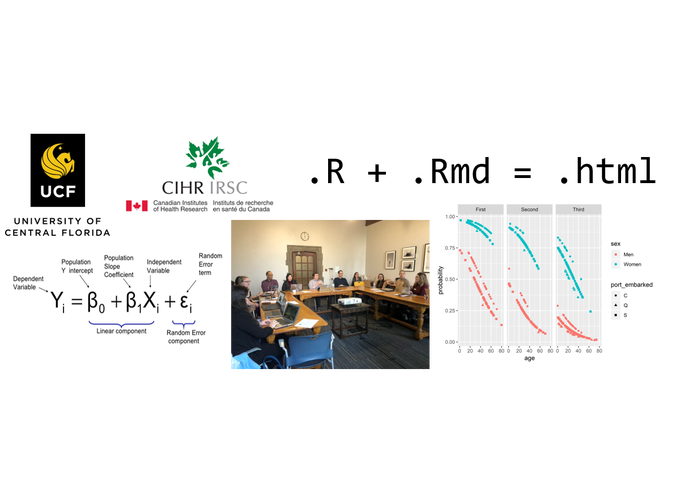
Recently I was invited to give a workshop on data analysis with R at the training retreat for Health System Impact Fellowship by Canadian Institutes of Health Research.
#CIHR_ImpactFellows immersed in a hands-on RStudio workshop, led by @andkovpro, Assistant Prof @ UCF and alumnus of the 2017 fellow cohort. Thank you @andkovpro ! #HSIF2019 #enrichedcorecomps #datascience pic.twitter.com/P0Qp3saMQF
— Meghan McMahon (@McMahon_Meg) November 26, 2019
The workshop was hosted at the picturesque Hart House of the University of Toronto:
 The workshop involved
Audience
My audience constisted of postdoctoral researchers and Ph.D. students, few of whom had experience with R, however majority have taken 3 or more courses in statistics and applied analysis. To gain better understanding of their background, I have asked them to fill out a brief survey (see results in my slides)
I had about 90 minutes, so I reasoned that instead of overwhelming them with technical information, which would leave little trace in their fatigued minds ( workshop was at the end of the day), I should create a resource that they would be able to use in the future. The time in workshop, then, should spent on gentle introduction to data analysis with R using the examples from this resource. This also gave my workshop the flexibility to accomodate learners of various skill levels: more advanced participants will have the material to study on their own if the talk leaves them underchallenged in any given point in time.
Learning Objectives
I wanted the audience to be exposed to examples of performing the following tasks:
- Organizing data analysis in a RMarkdown document
- Graphing the predictions of a statistical model (logistic regression)
- Jump-starting an analytic project using a project template
Deliverables
1. Organizing data analysis in a RMarkdown document
I have created two reports, containing identidcal code that implemented basic exploration of Titanic data with logistic regression:
- notebook-only - a notebook combining code and annotation in the same .Rmd file
- separate-layers - a report separating the analytic layer (.R) from the annotation layer (.Rmd)
Graphing a model
Carefull not to overwhelm with details, I chose to focus on a basic logistic regression model predicting survival in the Titanic data.
# Model 0
survived ~ sex

# Model 1
survived ~ sex + age

# Model 2
survived ~ sex + age + passenger_class

# Model 3
survived ~ sex + age + passenger_class + port_embarked
However, instead of focusing on interpreting the estimated parameters, I opted to generate predicted values and then to graph them to examine the effect respective variables would have on the binary outcome. We converted the log-odds into probabilities of the outcome (y-axis) and then mapped predictors on other visual dimension. To illustrate, the prediction for Model 2 survived ~ sex + age + passenger_class looked like this:
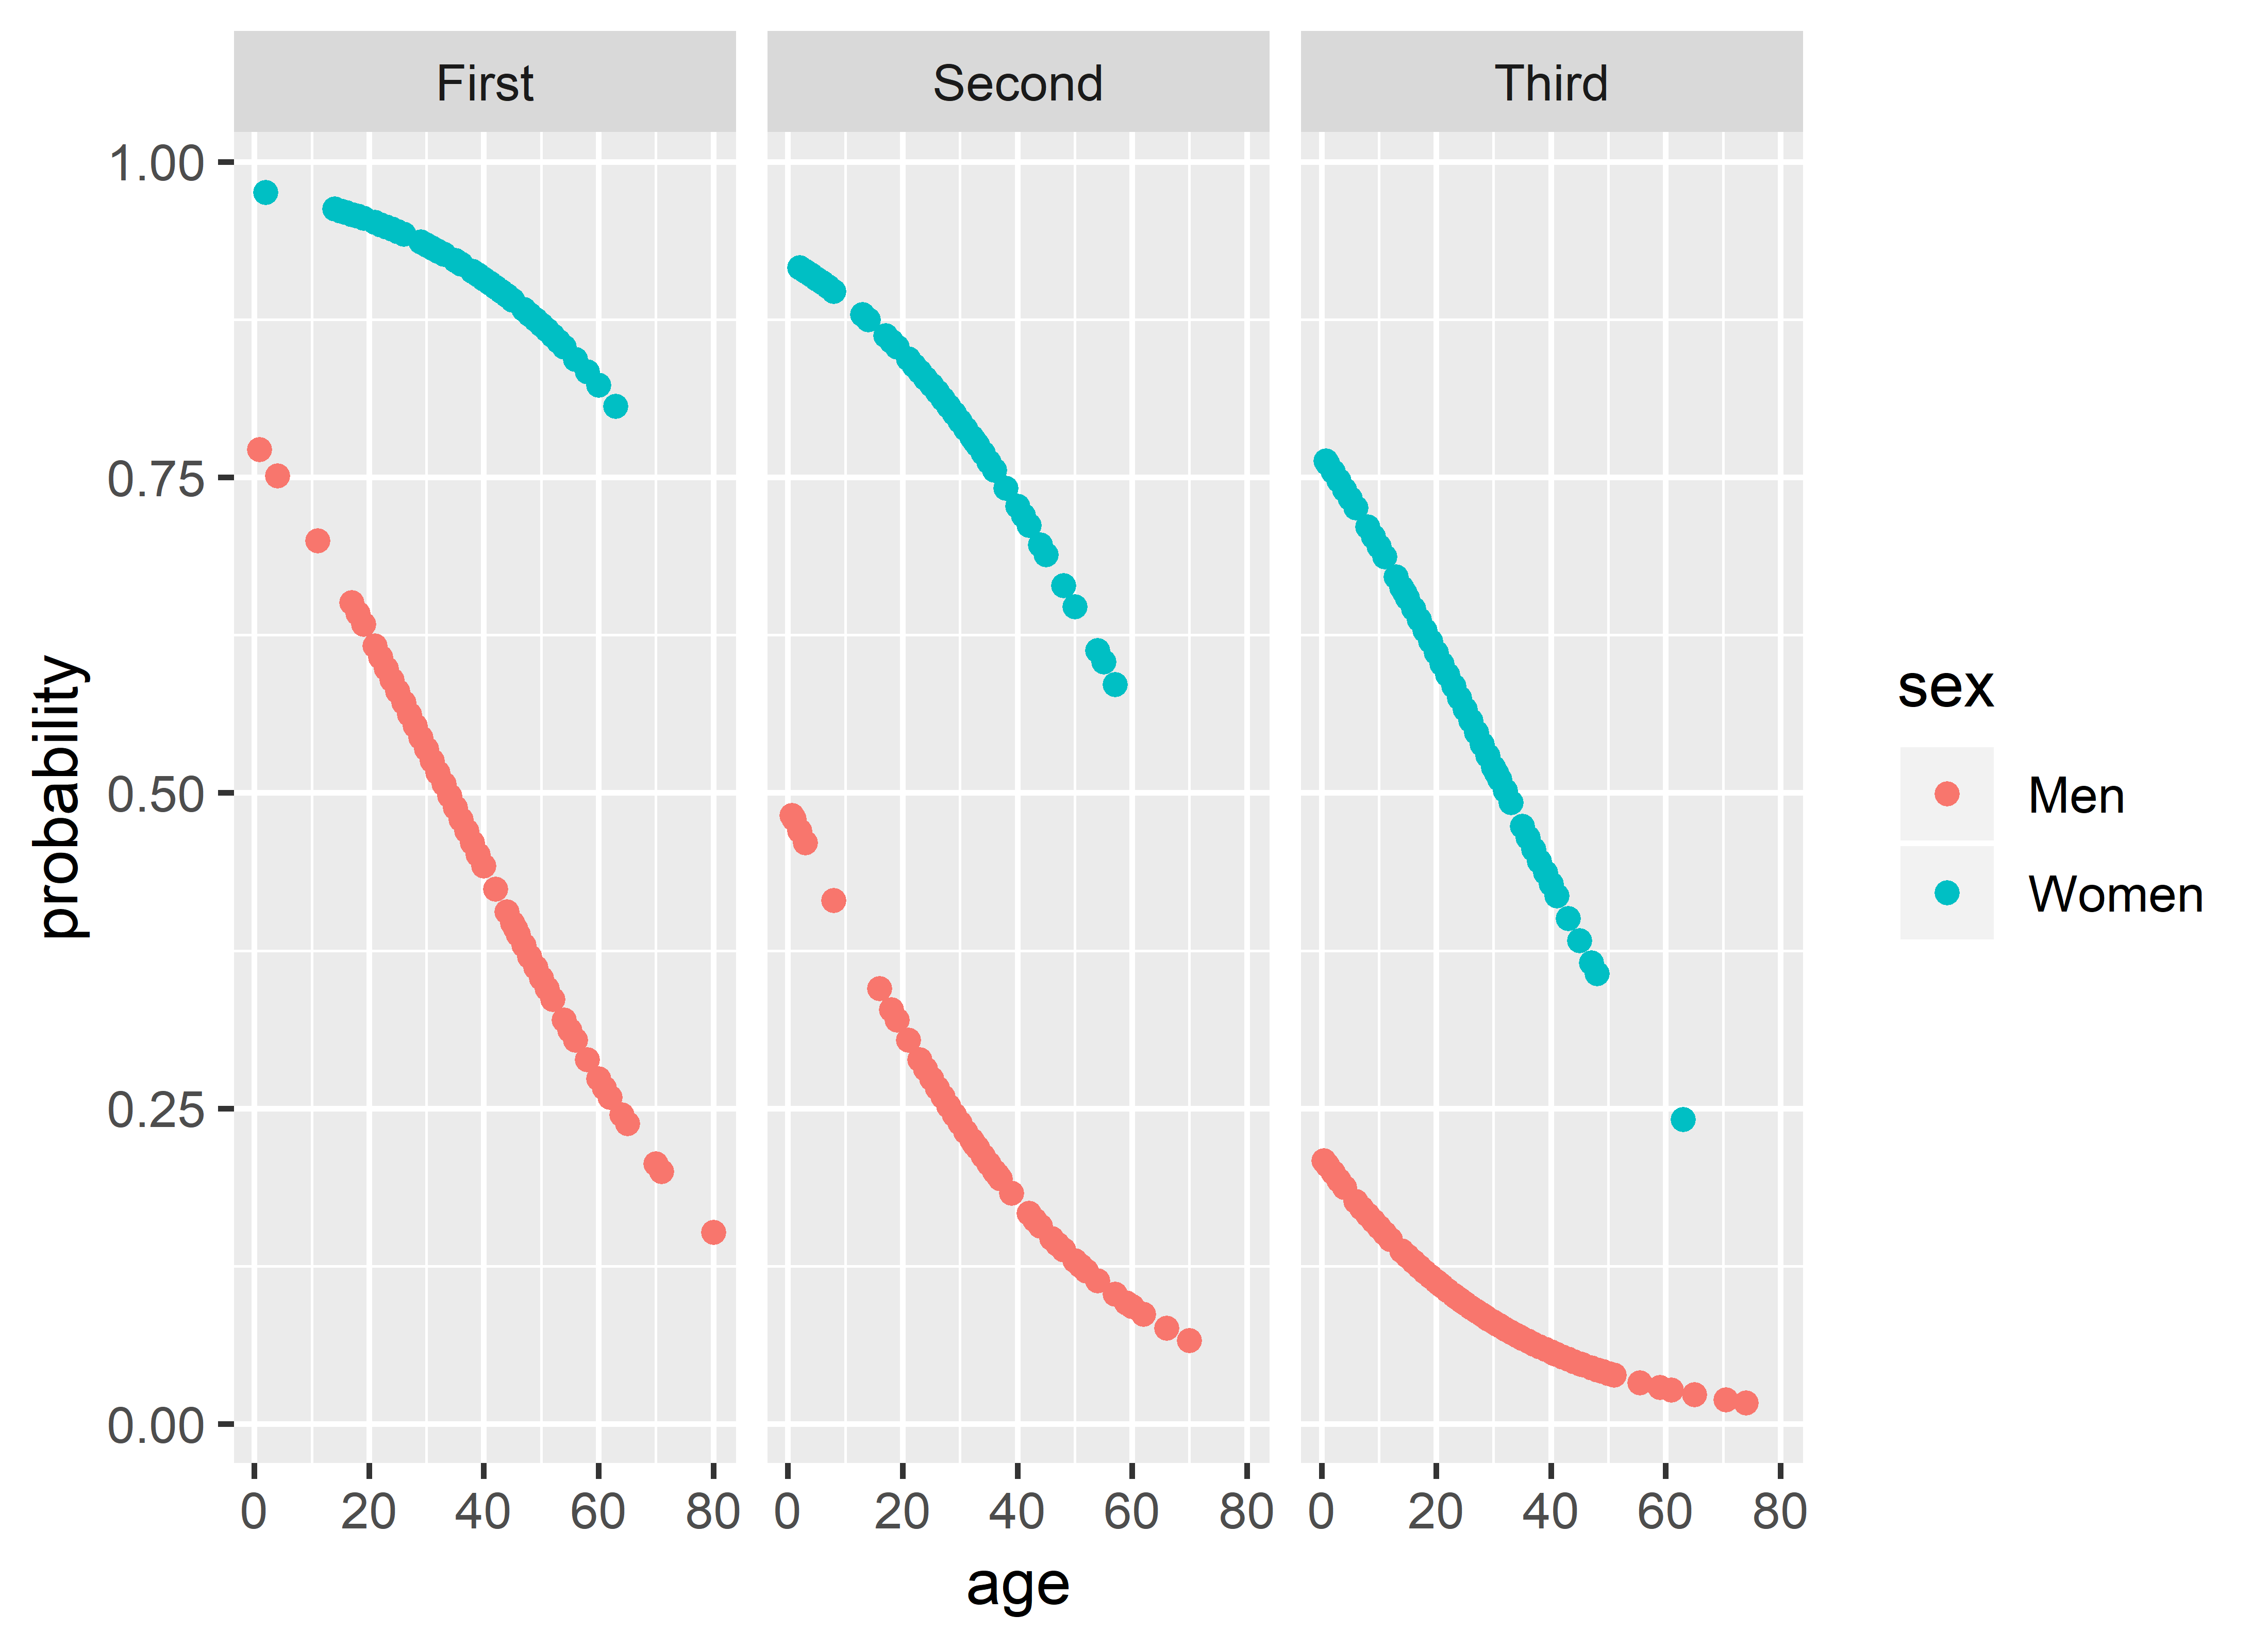
model_2
Materials
- notebook-only - analytic report as a notebook (combines code and annotation in the same
.Rmdfile) - separate-layers - analytic report separating the analytic layer (
.R) from the annotation layer (.Rmd) - presentation slides
Abstract
The workshop will review best practices of reproducible research including folder architecture, data preparation, graph making, statistical modeling, and script documentation. The workshop is targeted at researchers who are expected to conduct their own analysis of data and prepare reports that deliver the findings to both technical and executive audiences within health systems. Using logistic regression as an example, the participants will learn to communicate statistical findings more effectively, and will evaluate the advantages of using computational notebooks in RStudio to disseminate the results.